Decoding Data Analysis: Techniques, Tools, and Real-World Impact
Explore the top design trends for 2024 that will influence web, UI/UX, and branding projects, helping you stay ahead of the curve.
Insights
Jul 15, 2024

1. Understanding Data Analysis
Data analysis is the process of inspecting, cleaning, transforming, and modeling data to discover useful information, reach conclusions, and support decision-making.
It helps businesses identify patterns, solve problems, and seize new opportunities.
Key skills for data analysts include statistical literacy, domain expertise, and technical proficiency with tools like Excel, SQL, or Python.
The data analysis process is iterative—insights evolve as you refine methods and explore new questions.
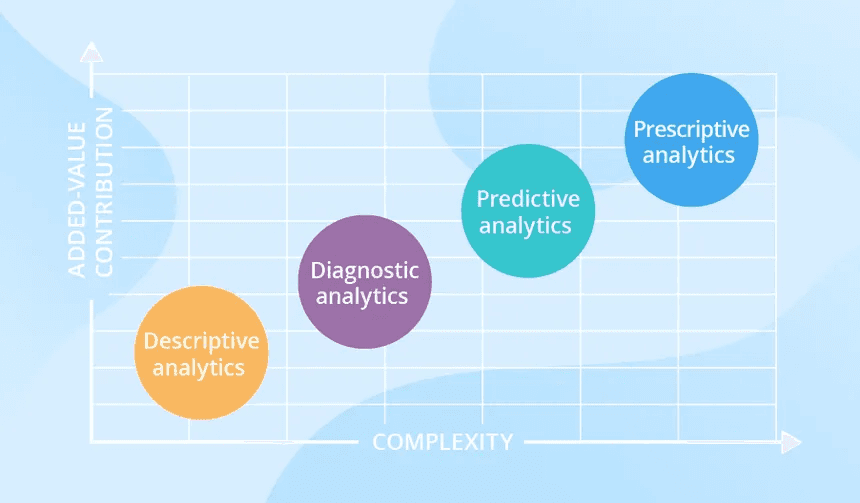
2. Types of Data Analysis
Descriptive Analysis: Summarizes historical data to show what has happened (e.g., sales trends, customer growth).
Diagnostic Analysis: Investigates why something happened by drilling into root causes or anomalies.
Predictive Analysis: Uses historical data to forecast future outcomes (e.g., sales projections).
Prescriptive Analysis: Recommends actions based on data modeling and optimization techniques.
3. Tools & Techniques
Popular tools include spreadsheets (Excel, Google Sheets), statistical programming (Python, R), and visualization platforms (Tableau, Power BI).
Techniques involve cleaning data, selecting relevant features, and building models to answer business questions.
Visualization methods (charts, graphs, dashboards) make complex data understandable and actionable.
Automation and scripting increase efficiency and ensure repeatable, scalable analysis.


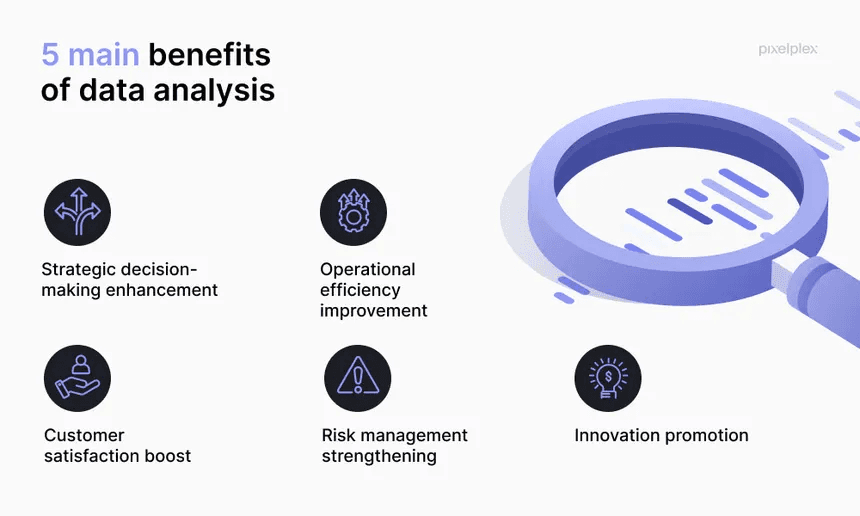
4. Real-World Applications
Companies use data analysis for marketing optimization, financial planning, customer segmentation, and operational improvement.
Healthcare organizations analyze patient data to predict outcomes, improve treatments, and manage resources.
Retailers leverage data to track inventory, optimize pricing, and personalize the customer experience.
Governments analyze population and economic data for policy development and resource allocation.
More to Discover


Decoding Data Analysis: Techniques, Tools, and Real-World Impact
Explore the top design trends for 2024 that will influence web, UI/UX, and branding projects, helping you stay ahead of the curve.
Insights
Jul 15, 2024
1. Understanding Data Analysis
Data analysis is the process of inspecting, cleaning, transforming, and modeling data to discover useful information, reach conclusions, and support decision-making.
It helps businesses identify patterns, solve problems, and seize new opportunities.
Key skills for data analysts include statistical literacy, domain expertise, and technical proficiency with tools like Excel, SQL, or Python.
The data analysis process is iterative—insights evolve as you refine methods and explore new questions.
2. Types of Data Analysis
Descriptive Analysis: Summarizes historical data to show what has happened (e.g., sales trends, customer growth).
Diagnostic Analysis: Investigates why something happened by drilling into root causes or anomalies.
Predictive Analysis: Uses historical data to forecast future outcomes (e.g., sales projections).
Prescriptive Analysis: Recommends actions based on data modeling and optimization techniques.
3. Tools & Techniques
Popular tools include spreadsheets (Excel, Google Sheets), statistical programming (Python, R), and visualization platforms (Tableau, Power BI).
Techniques involve cleaning data, selecting relevant features, and building models to answer business questions.
Visualization methods (charts, graphs, dashboards) make complex data understandable and actionable.
Automation and scripting increase efficiency and ensure repeatable, scalable analysis.
4. Real-World Applications
Companies use data analysis for marketing optimization, financial planning, customer segmentation, and operational improvement.
Healthcare organizations analyze patient data to predict outcomes, improve treatments, and manage resources.
Retailers leverage data to track inventory, optimize pricing, and personalize the customer experience.
Governments analyze population and economic data for policy development and resource allocation.
More to Discover
Decoding Data Analysis: Techniques, Tools, and Real-World Impact
Explore the top design trends for 2024 that will influence web, UI/UX, and branding projects, helping you stay ahead of the curve.
Insights
Jul 15, 2024
1. Understanding Data Analysis
Data analysis is the process of inspecting, cleaning, transforming, and modeling data to discover useful information, reach conclusions, and support decision-making.
It helps businesses identify patterns, solve problems, and seize new opportunities.
Key skills for data analysts include statistical literacy, domain expertise, and technical proficiency with tools like Excel, SQL, or Python.
The data analysis process is iterative—insights evolve as you refine methods and explore new questions.
2. Types of Data Analysis
Descriptive Analysis: Summarizes historical data to show what has happened (e.g., sales trends, customer growth).
Diagnostic Analysis: Investigates why something happened by drilling into root causes or anomalies.
Predictive Analysis: Uses historical data to forecast future outcomes (e.g., sales projections).
Prescriptive Analysis: Recommends actions based on data modeling and optimization techniques.
3. Tools & Techniques
Popular tools include spreadsheets (Excel, Google Sheets), statistical programming (Python, R), and visualization platforms (Tableau, Power BI).
Techniques involve cleaning data, selecting relevant features, and building models to answer business questions.
Visualization methods (charts, graphs, dashboards) make complex data understandable and actionable.
Automation and scripting increase efficiency and ensure repeatable, scalable analysis.
4. Real-World Applications
Companies use data analysis for marketing optimization, financial planning, customer segmentation, and operational improvement.
Healthcare organizations analyze patient data to predict outcomes, improve treatments, and manage resources.
Retailers leverage data to track inventory, optimize pricing, and personalize the customer experience.
Governments analyze population and economic data for policy development and resource allocation.